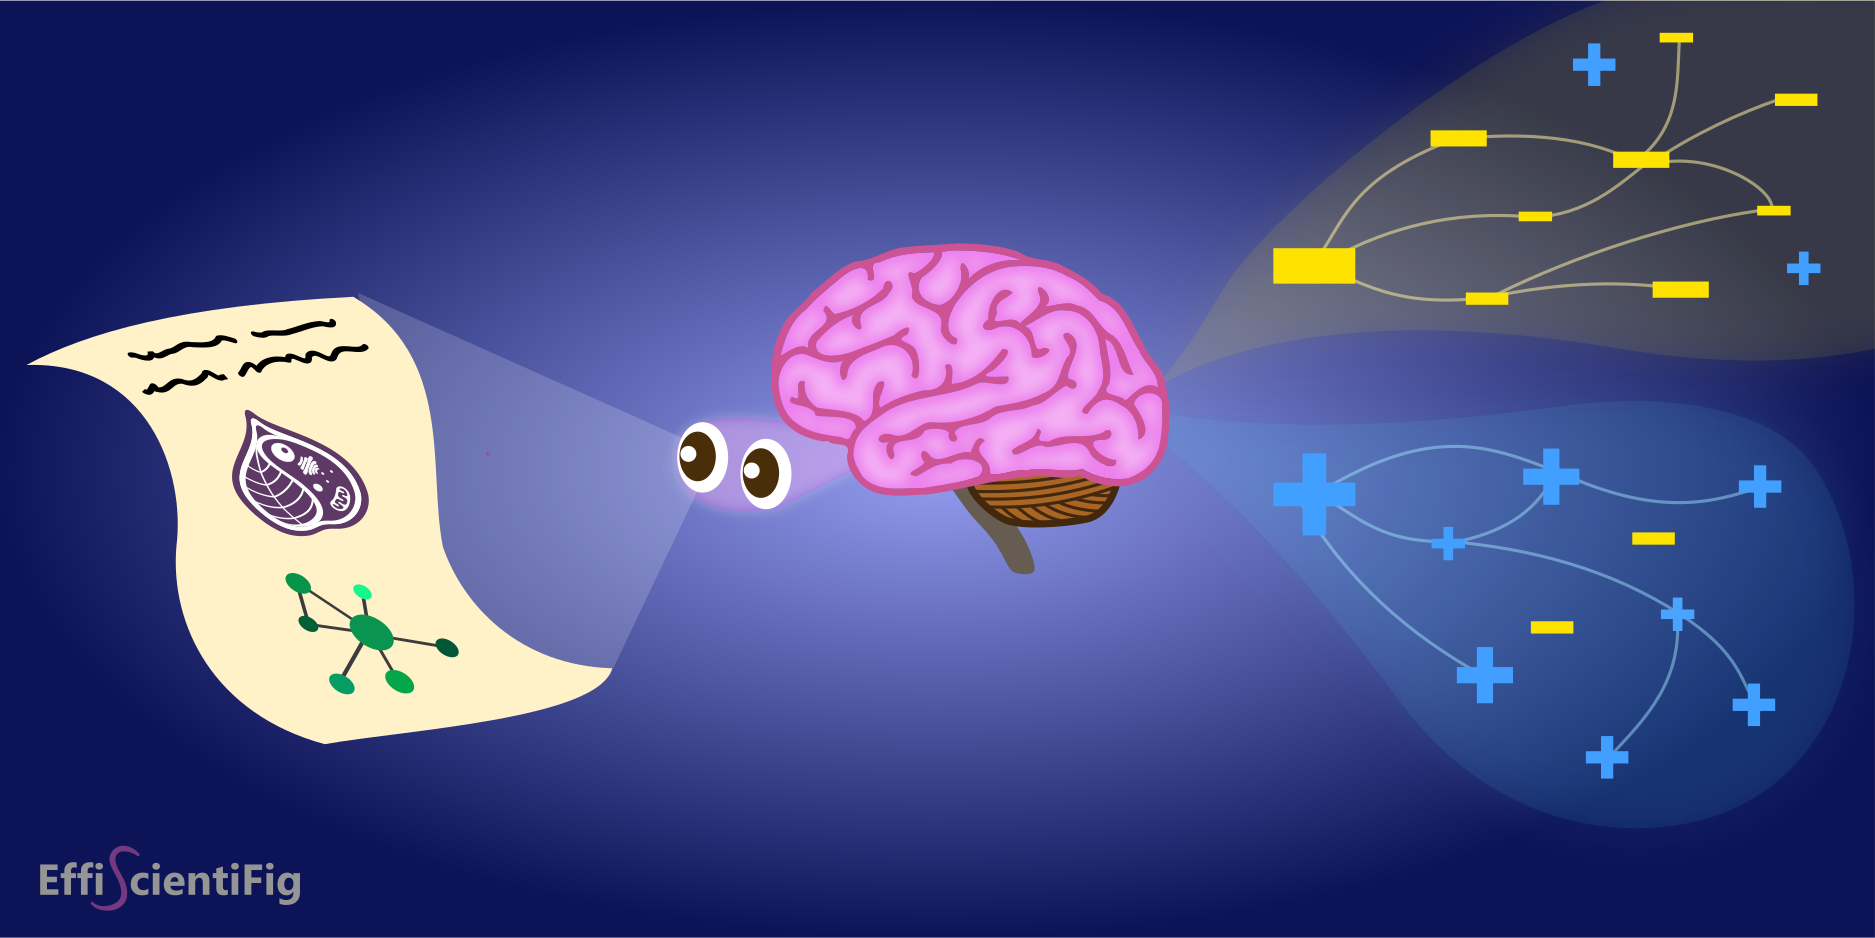
“The most important thing in communication is the first impression”.
“The most important thing in communication is the first impression”. I still vividly remember my communications teacher uttering this exact phrase as she stormed into the classroom to give us her first lesson, late, panting, and dressed in pink from head to toe. The slightly comical discrepancy between the meaning of these words and this animated arrival was a good illustration of a mixed first impression! Which this lively, pedagogical teacher immediately used by way of introduction, as an example of what not to do when arriving at a job interview or important meeting. The message certainly got through!
Why do first impressions matter so much? Quite simply because the human brain is lazy, or rather because its first response is to spare us complex, time-consuming and energy-intensive information processing. Halo effect, confirmation bias, anchoring effect… Numerous cognitive biases are at work in the formation of our judgments and in the choices we make; the decisions they lead to are often regarded as poorly thought-out and therefore non-rational. Nevertheless, decisions based on cognitive biases are not always bad1.
When we want to communicate a message, we have to deal with these biases, and in particular with the first impression bias, also known as the primacy effect. Like other cognitive biases, it corresponds to a limitation in human information processing. Our view of a given idea is strongly influenced by the first piece of information to which we are exposed. In fact, this first piece of information guides us (positively, negatively, or neutrally) in evaluating all the elements we are subsequently confronted with, with secondary judgments going in the same direction as the initial evaluation. The first element largely dominates the subsequent ones, which is all the more true when the first impression is negative2.
In many situations, the first piece of information is often visual, and it is then the message medium and/or the message bearer who conditions the initial judgment (and therefore the overall judgment, given the weight of the initial judgment). And the communication of scientific information is no exception to the first impression bias!
First impressions come into play when communicating science
As in many fields, visuals play a central role in communicating scientific results and ideas, especially as first impressions about scientific information are formed very quickly. For example, people decide whether they find an infographic attractive or not within 500 milli-seconds3. That’s 10 times longer than the time it takes to form an opinion about a website (50 ms 4), but it’s still only half a second.
Consequently, the public’s decision to take an interest in one science news story rather than another depends in part on aesthetic criteria5; scientific communication seems to be treated as a form of entertainment, where emotional impact and aesthetic appeal are sought-after qualities. To arouse initial interest in scientific information, the appearance of the media used is therefore of prime importance, and will also have an impact on the reach of the message communicated6. The aim is to capture the attention of the target audience and hold it long enough for the message to be understood, or even broadcast. Therefore, it is all about obtaining a high level of engagement from the audience, i.e. a high degree of involvement that translates into attention, interest and an emotional investment likely to generate active participation. For example, promoting a scientific article on social networks by circulating an illustration summarizing the study will have 2 to 3 times more impact than sharing a graphic from the article7.
As well as increasing engagement, the aesthetic qualities of scientific information also make it more accessible: well-designed visuals facilitate comprehension8 by reducing the cognitive load that can be associated with it (reduced need for concentration). Memorization of the message will also be enhanced when it is supported by a visual9, especially if the latter is designed to limit the amount of information to be retained. And the benefits of using engaging, effective scientific visuals are as valid for popularizing information to the public as they are for communicating within the scientific community.
Visuals also count for scientists
Scientists are not exempt from cognitive bias: despite their training and attachment to the scientific method, and thus a willingness to be rational and look for substance over form, they are also influenced by the way ideas and results are presented. Therefore, articles with attractive, informative visuals are more likely to be shared by peers and discussed within the scientific community. In fact, it has been shown that promoting an article on social networks can increase its citation rate10,11, indicating that an audience of specialists concerned by the subject has been reached by the article’s dissemination.
Moreover, the ever-increasing number of published scientific articles makes it more difficult to highlight one’s research amidst the outpouring of knowledge that abounds in scientific literature. Researchers need to stand out from the crowd, using relevant visuals to draw attention to their contribution and promote the dissemination of their work. It should also be borne in mind that some scientists may be interested in the results presented, but may not be experts in the field, as is the case with juries evaluating funding applications. Here again, clear, well-thought-out figures and graphical summaries can help to increase understanding of your work and make a convincing case.
The aesthetics of a scientific visual is therefore just as important for the communication of information addressed to the scientific community as it will be for dissemination to the general public. The decisive effect of the “first impression” explains the growing recognition of the importance of effective visual communication in scientific documents. However, with ever-growing and varied tasks, it is sometimes difficult for researchers to add the string of scientific visualization to their bow, or to find the time to devote to it. Calling on the services of a specialist in scientific visualization can be a solution to enhance the visibility of your work and increase its impact within the scientific community and on society at large.
References
1 Gigerenzer, G., & Gaissmaier, W. (2011). Heuristic decision making. Annual review of psychology, 62, 451-482.
2 Hirshleifer, D., Lourie, B., Ruchti, T. G., & Truong, P. (2021). First impression bias: Evidence from analyst forecasts. Review of Finance, 25(2), 325-364.
3 Harrison, L., Reinecke, K., & Chang, R. (2015, April). Infographic aesthetics: Designing for the first impression. Proceedings of the 33rd Annual ACM conference on human factors in computing systems (pp. 1187-1190).
4 Lindgaard, G., Fernandes, G., Dudek, C., & Brown, J. (2006). Attention web designers: You have 50 milliseconds to make a good first impression! Behaviour & information technology, 25(2), 115-126.
5 Gheorghiu, A. I., Callan, M. J., & Skylark, W. J. (2017). Facial appearance affects science communication. Proceedings of the National Academy of Sciences, 114(23), 5970-5975.
6 Perra, M., & Brinkman, T. (2021). Seeing science: using graphics to communicate research. Ecosphere, 12(10), e03786.
7 Oska, S., Lerma, E., & Topf, J. (2020). A picture is worth a thousand views: a triple crossover trial of visual abstracts to examine their impact on research dissemination. Journal of Medical Internet Research, 22(12), e22327.
8 Courtney, S. L., & McNeal, K. S. (2023). Seeing is believing: Climate change graph design and user judgments of credibility, usability, and risk. Geosphere, 19(6), 1508-1527.
9 Wang, Z., Wang, S., Farinella, M., Murray-Rust, D., Henry Riche, N., & Bach, B. (2019, May). Comparing effectiveness and engagement of data comics and infographics. Proceedings of the 2019 CHI Conference on Human Factors in Computing Systems (pp. 1-12).
10 Betz, K., Knuf, F., Duncker, D., Giordano, M., Dobrev, D., & Linz, D. (2021). The impact of Twitter promotion on future citation rates: the# TweetTheJournal study. International Journal of Cardiology. Heart & Vasculature, 33.
11 Hou, L. T., Pierorazio, P. M., & Koo, K. (2020). Impact of social media visual abstracts on media attention and literature citation in urology. Journal of Urology, 204(5), 905-906.


